Rivers that look clean, air that smells fresh, and soil that appears fertile can still contain invisible pollutants capable of harming ecosystems and human health. These contaminants often exist at extremely low concentrations—too small to see, taste, or smell—yet powerful enough to disrupt biological systems.
This is why PPM in environmental chemistry plays a critical role in pollution monitoring and environmental protection.
Using parts per million (ppm), scientists measure trace levels of toxic metals, pesticides, industrial chemicals, and nutrients. Even a small error in ppm calculation can result in:
- Undetected ecosystem damage
- Unsafe drinking water
- Wildlife population decline
- Regulatory non-compliance
- Long-term environmental degradation
In this guide, you will learn how ppm is used to interpret trace pollutants, why low concentrations matter, how regulators set safe limits, and how professionals ensure reliable concentration measurement in environmental monitoring.
What Is PPM in Environmental Chemistry?
Understanding Parts Per Million
Parts per million (ppm) represents one part of a substance in one million parts of air, water, soil, or sediment.
In environmental studies:
- Water:
1 ppm ≈ 1 mg/L - Soil:
1 ppm ≈ 1 mg/kg - Air:
1 ppm ≈ 1 µL/L (volume basis)
This flexibility makes ppm a universal unit for environmental analysis.
Why PPM Is the Standard in Environmental Monitoring
PPM is widely used because it:
✔ Detects trace pollutants
✔ Works across media (air, water, soil)
✔ Matches regulatory frameworks
✔ Supports long-term trend analysis
✔ Enables global data comparison
It forms the foundation of modern environmental chemistry.
Why Low Concentrations Matter in Environmental Systems
The “Small Amount, Big Impact” Principle
In environmental chemistry, toxicity does not always correlate with quantity. Many substances cause damage even at ppm or ppb levels.
Examples:
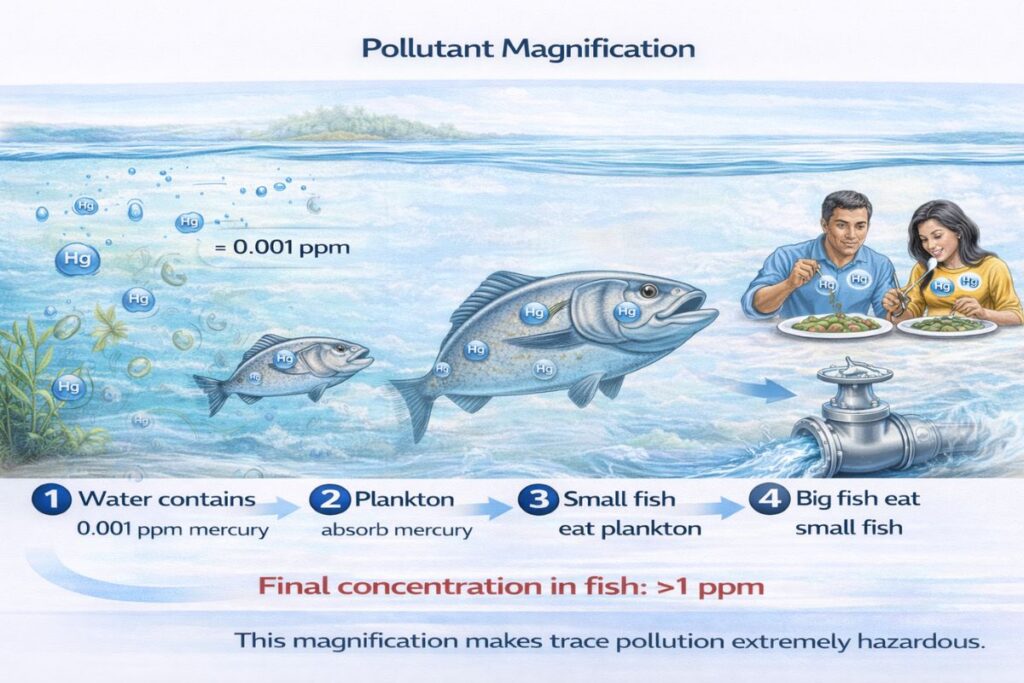
- Mercury at 0.002 ppm can poison fish
- Arsenic at 0.01 ppm increases cancer risk
- Pesticides at 0.05 ppm disrupt insects
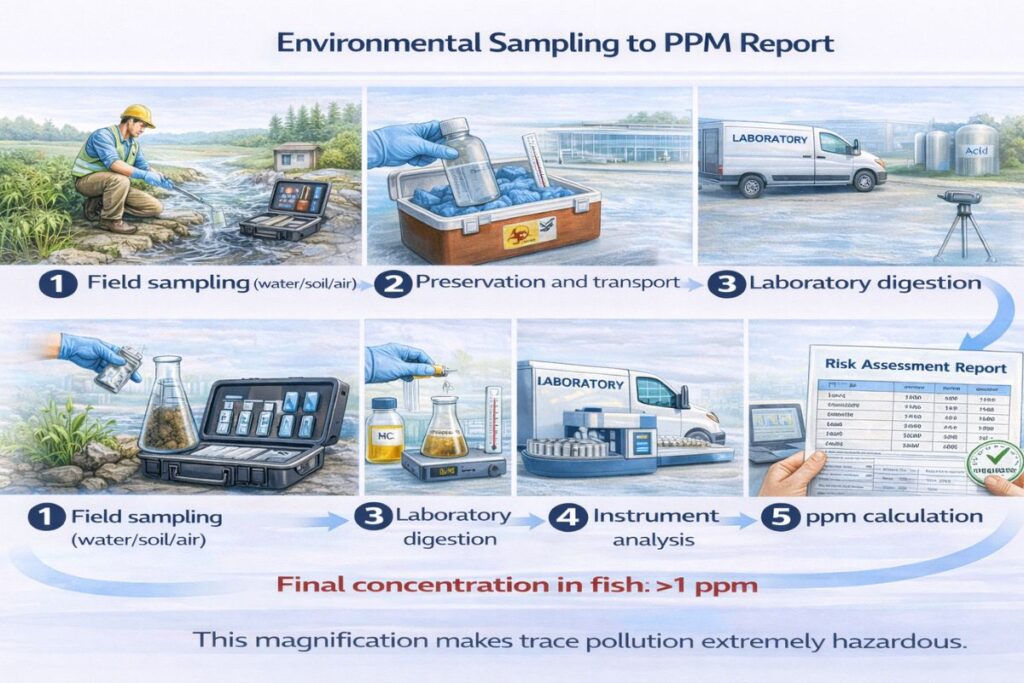
Bioaccumulation and Biomagnification
Low concentrations become dangerous through food chains.
Common Environmental Pollutants Measured in PPM
| Pollutant | Source | Typical Range (ppm) | Impact |
|---|---|---|---|
| Lead | Pipes, mining | <0.015 | Neurotoxicity |
| Mercury | Coal plants | <0.002 | Bioaccumulation |
| Nitrate | Fertilizers | <10 | Eutrophication |
| Arsenic | Groundwater | <0.01 | Cancer |
| Pesticides | Agriculture | <0.05 | Ecosystem damage |
| Oil residues | Spills | <1.0 | Aquatic toxicity |
These values define acceptable ppm in environmental chemistry assessments.
Role of PPM in Water, Air, and Soil Monitoring
1. Water Pollution Monitoring
PPM is used to assess:
- Heavy metals
- Nutrients
- Industrial waste
- Organic pollutants
Example:
Nitrate >10 ppm → Unsafe for infants
2. Air Quality Analysis
Air pollutants measured in ppm include:
- Carbon monoxide (CO)
- Nitrogen dioxide (NO₂)
- Sulfur dioxide (SO₂)
Example:
CO >9 ppm (8-hour average) → Health risk
3. Soil and Sediment Assessment
Soil ppm values determine:
- Agricultural suitability
- Contamination levels
- Remediation needs
Example:
Lead >100 ppm → Land-use restriction
PPM Formula in Environmental Chemistry
Standard PPM Formula
PPM = (Mass of Pollutant / Mass of Sample) × 1,000,000
For Water Systems
PPM ≈ mg/L
For Soil Samples
PPM ≈ mg/kg
For Diluted Samples
PPM = (C × V × D) / W
Where:
- C = Instrument reading (mg/L)
- V = Volume (L)
- D = Dilution factor
- W = Sample mass (kg)
These formulas support reliable ppm calculation.
Calculation Walkthrough: Measuring Arsenic in River Water
Given Data
- Instrument reading: 0.008 mg/L
- Dilution: 1
- Sample type: Water
Step 1: Convert to PPM
PPM = 0.008 mg/L ≈ 0.008 ppm
Step 2: Compare with Limit
WHO limit = 0.01 ppm
Result
0.008 < 0.01 → Safe
This is a practical ppm example in environmental monitoring.
PPM to mg/L Conversion in Environmental Studies
General Rule (Water)
1 ppm = 1 mg/L
Example
Cadmium = 0.004 mg/L
= 0.004 ppm
Exception
High-salinity water requires density correction.
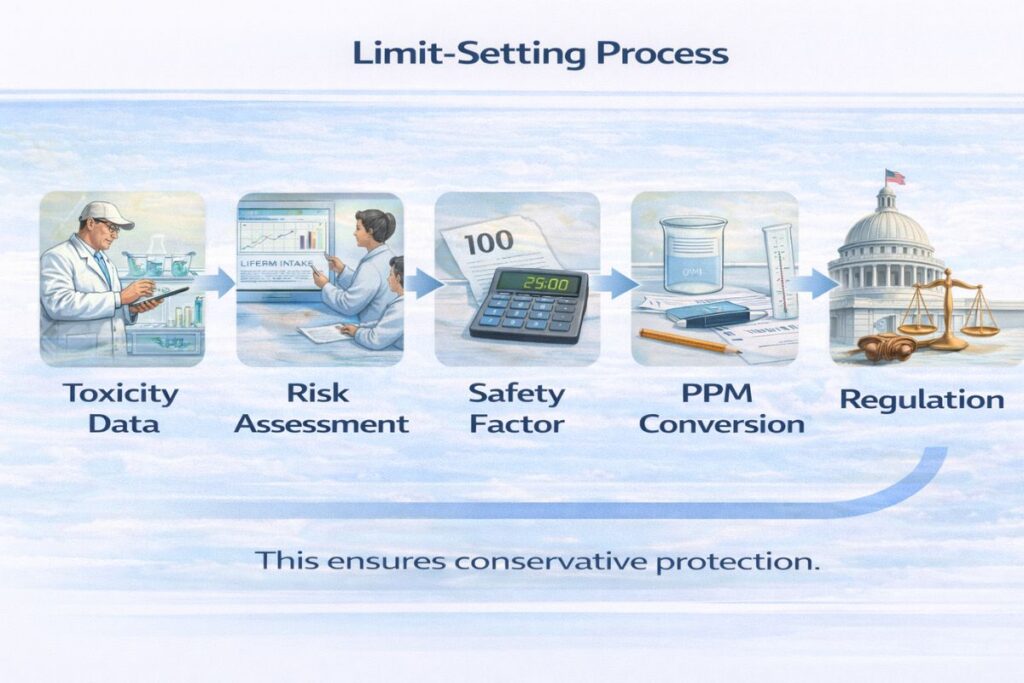
How Regulators Set Safe PPM Limits
Step 1: Toxicological Studies
Determine No-Observed-Adverse-Effect Level (NOAEL).
Step 2: Safety Factor Application
Apply 100–1000× safety margins.
Step 3: Exposure Modeling
Estimate daily intake from water, food, air.
Step 4: PPM Conversion
Convert safe intake to environmental concentration.
Step 5: Legal Adoption
Governments enforce limits.
Global Standards for Environmental PPM Limits
| Pollutant | WHO (ppm) | EPA (ppm) | EU (ppm) |
|---|---|---|---|
| Arsenic | 0.01 | 0.01 | 0.01 |
| Lead | 0.01 | 0.015 | 0.01 |
| Mercury | 0.006 | 0.002 | 0.001 |
| Nitrate | 50 | 10 | 50 |
| Chromium | 0.05 | 0.1 | 0.05 |
These limits guide environmental compliance.
Industry Case Study 1: Mercury Contamination in Wetlands
Background
Industrial discharge polluted a wetland.
Test Results:
- Mercury: 0.015 ppm
- Limit: 0.002 ppm
Impact
- Fish mortality
- Bird population decline
- Fishing ban
Response
- Source closure
- Sediment removal
- Long-term monitoring
After 5 years: Mercury reduced to 0.001 ppm.
Industry Case Study 2: Agricultural Runoff and Lake Eutrophication
Scenario
Lake receiving fertilizer runoff.
Measurements:
- Nitrate: 22 ppm
- Phosphate: 3 ppm
Effects
- Algal blooms
- Oxygen depletion
- Fish deaths
Solution
- Buffer zones
- Controlled fertilizer use
- Continuous ppm monitoring
Result: 60% nutrient reduction.
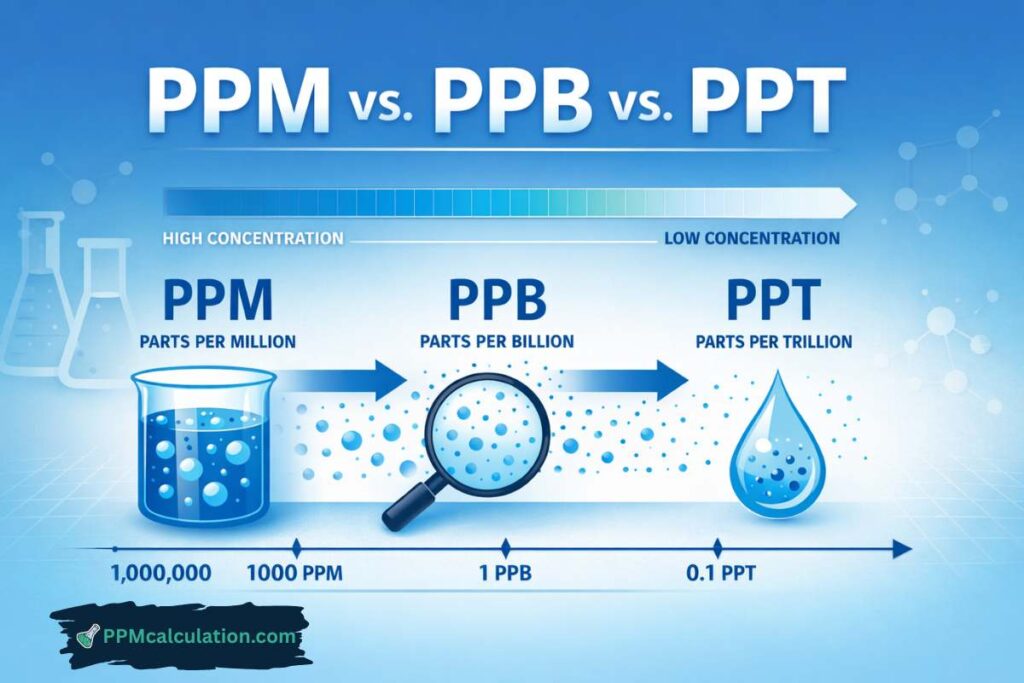
Comparison: PPM vs PPB vs PPT in Environmental Chemistry
| Unit | Magnitude | Use Case |
|---|---|---|
| PPM | 10⁻⁶ | Nutrients, salts |
| PPB | 10⁻⁹ | Heavy metals |
| PPT | 10⁻¹² | Persistent toxins |
Environmental studies often shift between these units.
Tools & Calculators for Environmental PPM Analysis
Manual calculations are prone to error. Digital tools improve reliability.
Trusted Platform: ppmcalculation.com
ppmcalculation.com provides professional tools for environmental scientists and regulators:
Benefits
- Validated ppm formulas
- Instant results
- Mobile-friendly design
- No registration
- Audit-ready outputs
These tools support accurate environmental reporting.
Common Mistakes in Environmental PPM Interpretation
1. Ignoring Bioaccumulation
Low water ppm may still be dangerous.
2. Mixing Units
Confusing ppb with ppm.
3. Poor Sampling Design
Unrepresentative samples distort trends.
4. Overlooking Seasonal Variations
Rainfall and temperature affect concentrations.
5. Inadequate Detection Limits
Using instruments with insufficient sensitivity.
Frequently Asked Questions (FAQs)
1. Why are trace pollutants dangerous at ppm levels?
Because of bioaccumulation, chronic exposure, and ecosystem sensitivity.
2. Is ppm enough for toxic metals?
Often no. Many metals require ppb analysis.
3. How often should environmental ppm be monitored?
Monthly to continuous, depending on risk.
4. Can consumers measure environmental ppm?
Basic kits exist, but labs provide reliable results.
5. Do ppm limits vary by country?
Yes, but most follow WHO guidelines.
6. What industries use environmental ppm data most?
Mining, chemicals, agriculture, energy, and waste management.
Why PPM in Environmental Chemistry Protects the Planet
Understanding PPM in environmental chemistry is essential for identifying invisible threats and protecting ecosystems.
Key Takeaways
✔ PPM reveals trace pollution
✔ Small concentrations can cause major damage
✔ Accurate ppm calculation supports regulation
✔ Monitoring prevents ecological collapse
✔ Digital tools improve reliability
From rivers to forests, ppm-based analysis forms the backbone of environmental protection.
Related PPM Calculators
Explore more water quality and chemistry tools: