Clean drinking water is one of the most essential public health requirements in modern society. From municipal supply systems to industrial water treatment plants, every liter of water must meet strict quality and safety standards before reaching consumers.
At the center of this process lies PPM calculation in water treatment and purification. Engineers, operators, and regulators rely on parts per million (ppm) measurements to determine chemical dosing, monitor contaminants, and ensure compliance with legal limits.
A small error in ppm calculation can result in:
- Under-dosing, leading to microbial contamination
- Over-dosing, causing chemical toxicity
- Regulatory violations and penalties
- Loss of public trust
Whether you are a water treatment professional, environmental engineer, student, or concerned consumer, understanding how ppm works is essential for safe water management.
This guide explains the science, formulas, applications, real-world examples, and best practices of ppm measurement in water purification systems.
What Is PPM in Water Treatment?
Understanding Parts Per Million
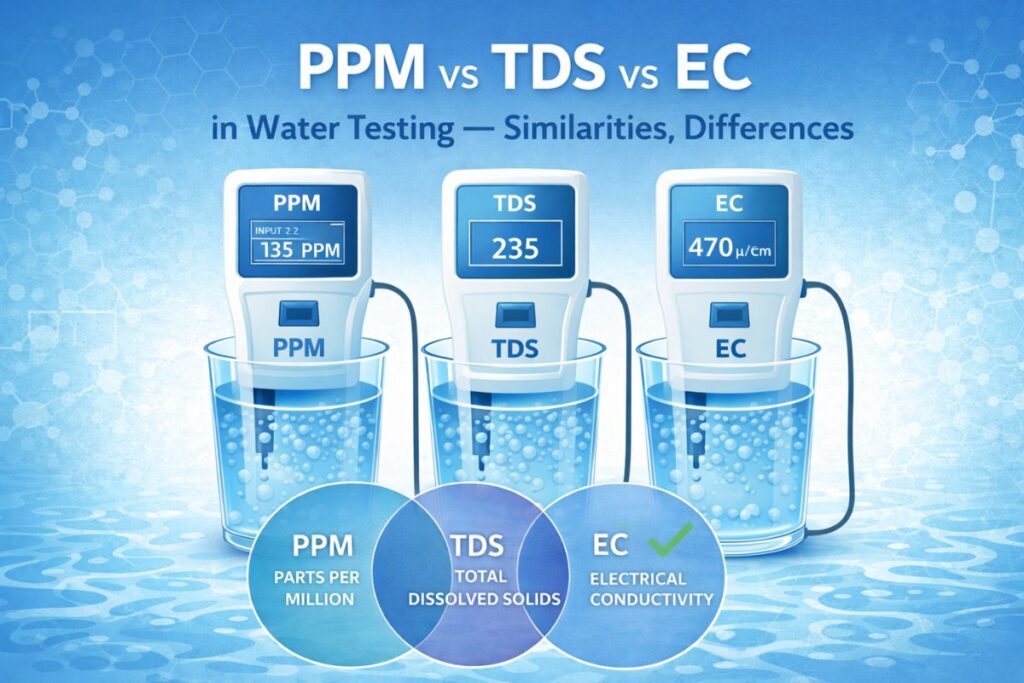
Parts per million (ppm) expresses the concentration of a substance relative to one million parts of water.
In water systems:
1 ppm ≈ 1 mg/L
This equivalence exists because 1 liter of water weighs approximately 1 kilogram.
Why PPM Is the Standard Unit
PPM is widely used in water treatment because it is:
✔ Easy to calculate
✔ Compatible with lab instruments
✔ Recognized by regulators
✔ Suitable for low-level contaminants
It enables precise concentration measurement for both chemicals and pollutants.
Role of PPM Calculation in Water Treatment and Purification
PPM measurements guide almost every stage of water treatment.
1. Chemical Dosing Control
Treatment plants use chemicals to:
- Disinfect water
- Remove turbidity
- Adjust pH
- Control corrosion
Each chemical is dosed based on ppm values.
2. Contaminant Monitoring
Water is continuously tested for:
- Heavy metals
- Microorganisms
- Nitrates
- Fluoride
- Organic compounds
All limits are defined in ppm or lower units.
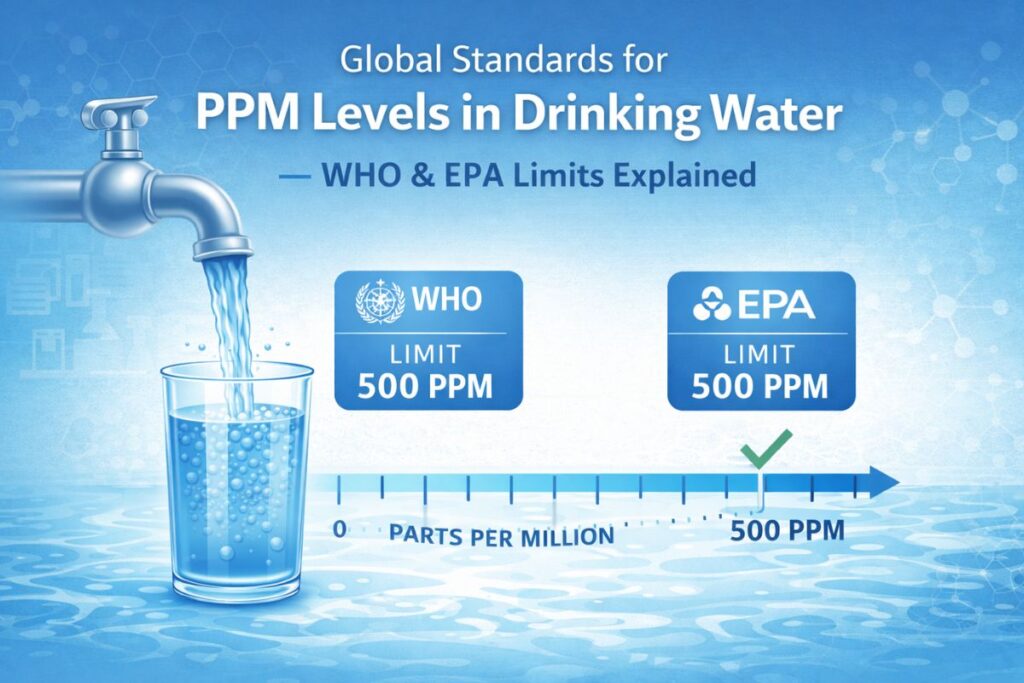
3. Regulatory Compliance
Government agencies define maximum allowable concentrations in ppm or ppb.
Example:
| Parameter | Limit |
|---|---|
| Chlorine | 4 ppm |
| Fluoride | 1.5 ppm |
| Nitrate | 10 ppm |
| Lead | 0.015 ppm |
4. Public Health Protection
Accurate ppm control prevents:
- Waterborne diseases
- Chemical poisoning
- Long-term toxicity
Key Water Treatment Parameters Measured in PPM
| Parameter | Purpose | Typical Range |
|---|---|---|
| Chlorine | Disinfection | 0.2–4 ppm |
| Turbidity | Clarity | <1 ppm |
| TDS | Dissolved solids | <500 ppm |
| Fluoride | Dental health | 0.7–1.2 ppm |
| Iron | Aesthetic quality | <0.3 ppm |
| Nitrate | Health safety | <10 ppm |
These values are monitored daily in treatment plants.
PPM Formula for Water Treatment Applications
Standard PPM Formula
The basic ppm formula is:
PPM = (Mass of Solute / Mass of Solution) × 1,000,000
For water systems:
PPM ≈ mg/L
Practical Engineering Formula
For dosing calculations:
Required Chemical (mg) = Desired ppm × Volume (L)
This simplified formula is widely used in plant operations.
Calculation Walkthrough: Chlorine Dosing Example
Scenario
A treatment plant needs to dose chlorine at 2 ppm in a 50,000 L storage tank.
Step 1: Apply Formula
Required Chlorine (mg) = 2 ppm × 50,000 L
= 100,000 mg
Step 2: Convert to Grams
100,000 mg = 100 g
Result
The plant must add 100 grams of chlorine.
This is a classic ppm example used in daily operations.
PPM to mg/L Conversion in Water Treatment
Why It Matters
Most laboratory reports provide results in mg/L. Operators often need ppm.
Conversion Rule
For water:
1 ppm = 1 mg/L
Example
Laboratory report:
Arsenic = 0.05 mg/L
= 0.05 ppm
This is above the safe limit (0.01 ppm), requiring immediate action.
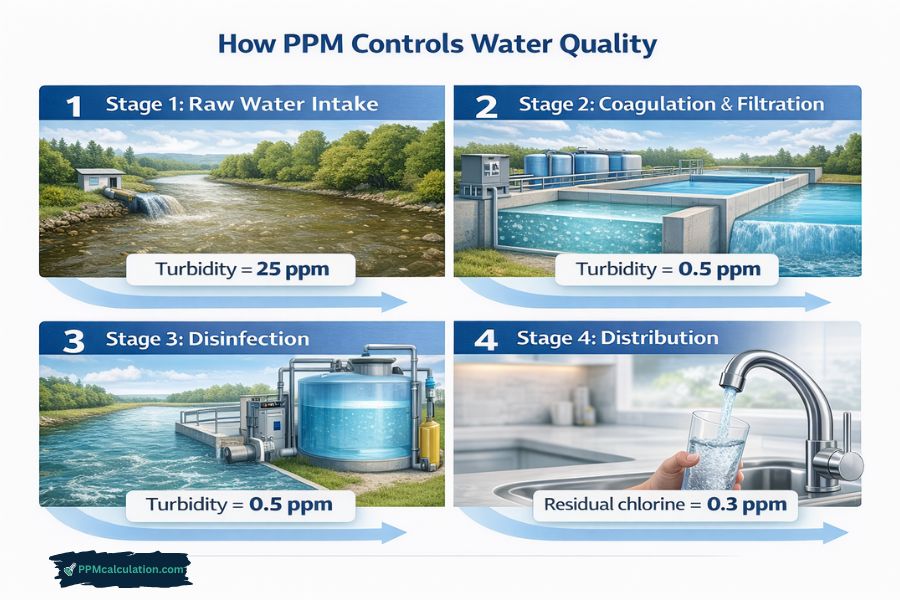
This stepwise reduction demonstrates how ppm guides purification.
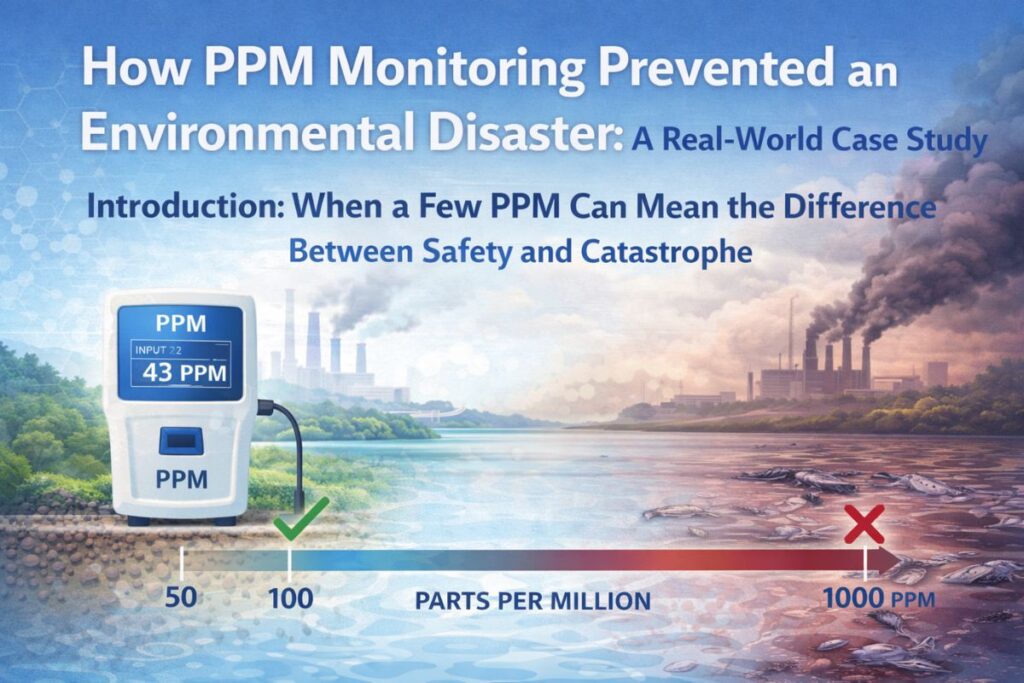
Industry Case Study 1: Municipal Water Chlorination Failure
Background
A mid-sized city experienced bacterial contamination.
Test Results:
- Chlorine residual: 0.05 ppm
- Required minimum: 0.2 ppm
Analysis
Under-dosing reduced disinfection efficiency.
Impact
- 3,000 people affected
- Temporary boil-water advisory
- ₹1.2 crore remediation cost
Solution
Improved real-time ppm monitoring and automated dosing.
Industry Case Study 2: Fluoride Overdosing Incident
Scenario
A rural treatment plant overdosed fluoride.
Measured:
- Fluoride = 3.8 ppm
- Standard limit = 1.5 ppm
Root Cause
Manual ppm calculation error.
Consequences
- Dental fluorosis risk
- Public complaints
- Legal action
Prevention
Adoption of digital ppm converters and training.
Comparison: Manual vs Automated PPM Control
| Feature | Manual System | Automated System |
|---|---|---|
| Accuracy | Medium | High |
| Response Time | Slow | Real-time |
| Human Error | High | Low |
| Cost | Low | Medium |
| Compliance | Risky | Reliable |
Modern plants increasingly prefer automated systems.
PPM in Different Water Treatment Processes
1. Coagulation and Flocculation
Alum dosing: 10–50 ppm
Controls suspended solids removal.
2. Softening
Lime dosing: 100–300 ppm
Reduces hardness.
3. Reverse Osmosis
Feed TDS: <2,000 ppm
Permeate: <50 ppm
4. Disinfection
Chlorine/Ozone: 0.5–3 ppm
Ensures pathogen control.
Tools & Calculators for PPM Calculation
Manual calculation is useful, but digital tools increase efficiency.
Trusted Platform: ppmcalculation.com
ppmcalculation.com provides professional-grade tools for water engineers and operators, including:
Benefits
- High accuracy
- Instant results
- Mobile compatibility
- No registration required
- Engineering-tested formulas
These tools support daily plant operations and compliance reporting.
Common Mistakes in PPM Calculation for Water Systems
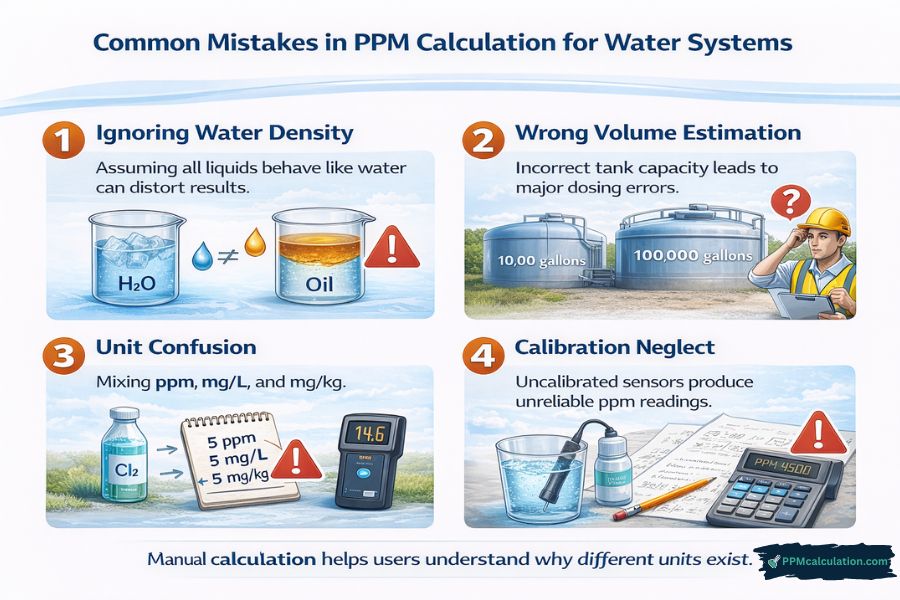
1. Ignoring Water Density
Assuming all liquids behave like water can distort results.
2. Wrong Volume Estimation
Incorrect tank capacity leads to major dosing errors.
3. Unit Confusion
Mixing ppm, mg/L, and mg/kg.
4. Calibration Neglect
Uncalibrated sensors produce unreliable ppm readings.
5. Over-Reliance on Manual Methods
Manual calculation increases operational risk.
Frequently Asked Questions (FAQs)
1. Why is ppm used instead of percentage in water treatment?
Because contaminants are usually present in very small amounts, making percentages impractical.
2. Is ppm the same as mg/L for all waters?
Only for water with density near 1 kg/L. High salinity requires correction.
3. How often should ppm be monitored?
Critical parameters like chlorine should be monitored continuously or hourly.
4. What is the safe chlorine level in drinking water?
Typically between 0.2 and 4 ppm.
5. Can consumers measure ppm at home?
Yes. Test kits and digital meters can measure basic parameters like TDS and chlorine.
6. Which contaminants require ppb monitoring?
Lead, arsenic, mercury, and pesticides are often regulated in ppb.
Why PPM Calculation Drives Safe Water Systems
PPM calculation in water treatment and purification is the foundation of modern drinking water safety.
Key Takeaways
✔ PPM controls chemical dosing
✔ Ensures regulatory compliance
✔ Protects public health
✔ Optimizes treatment efficiency
✔ Prevents costly failures
From coagulation to disinfection, every treatment stage depends on accurate parts per million measurement.
Related PPM Calculators
Explore more water quality and chemistry tools: