When a Few PPM Can Mean the Difference Between Safety and Catastrophe
Industrial facilities operate with chemicals that, even at low concentrations, can pose serious risks to ecosystems and human health. In environmental protection, early detection at the parts per million (ppm) level often determines whether a minor leak becomes a full-scale disaster.
This case study explores how ppm monitoring prevented an environmental disaster when trace chemical detection in a river system triggered rapid intervention. The incident demonstrates the importance of precise ppm calculation, real-time concentration measurement, and regulatory compliance in modern environmental management.
Even a difference of 0.5 ppm can decide whether:
- Fish populations survive
- Drinking water remains safe
- A company faces multi-million-dollar penalties
- A local community is evacuated
Understanding how ppm monitoring works—and why it matters—can help industries, regulators, and environmental professionals prevent future crises.
Background: The Industrial River Corridor
The Setting
A mid-sized chemical manufacturing plant was located upstream of a river supplying drinking water to approximately 1.2 million people. The plant handled organic solvents and metal-based catalysts.
Regulatory Framework
The facility operated under strict discharge permits requiring:
- Continuous monitoring
- Monthly compliance reporting
- Maximum contaminant levels expressed in ppm
The regulated pollutant in focus: Phenolic compounds, with a discharge limit of 0.5 ppm.
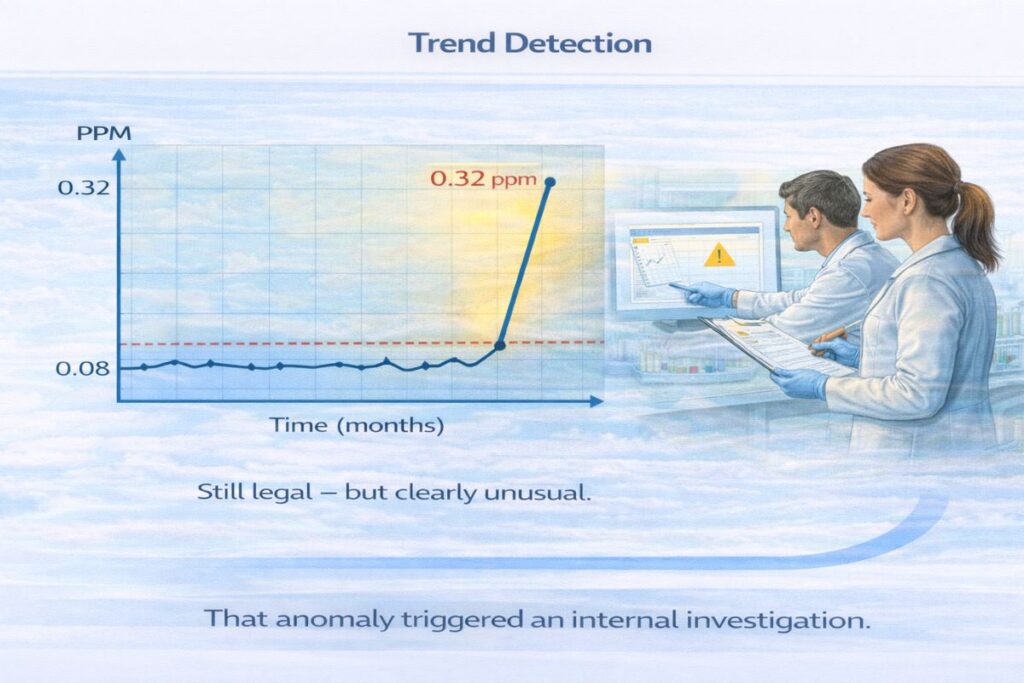
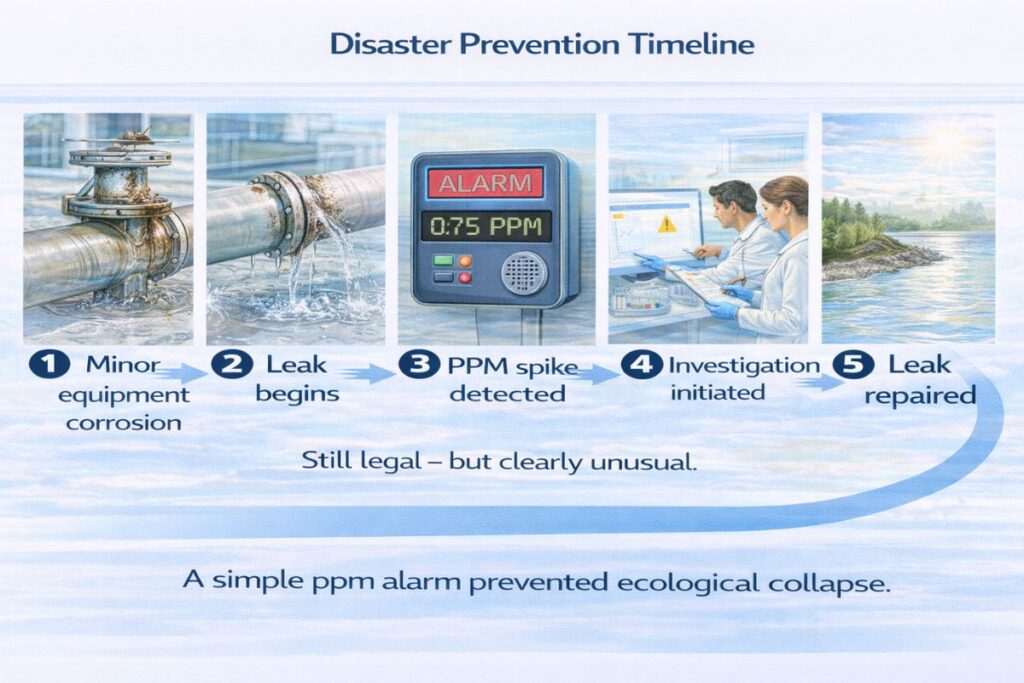
The Early Warning Signal: A Slight PPM Increase
During routine automated monitoring, sensors recorded:
- Baseline average: 0.08 ppm
- Sudden reading: 0.32 ppm
Though still below the 0.5 ppm legal threshold, the increase was statistically abnormal.
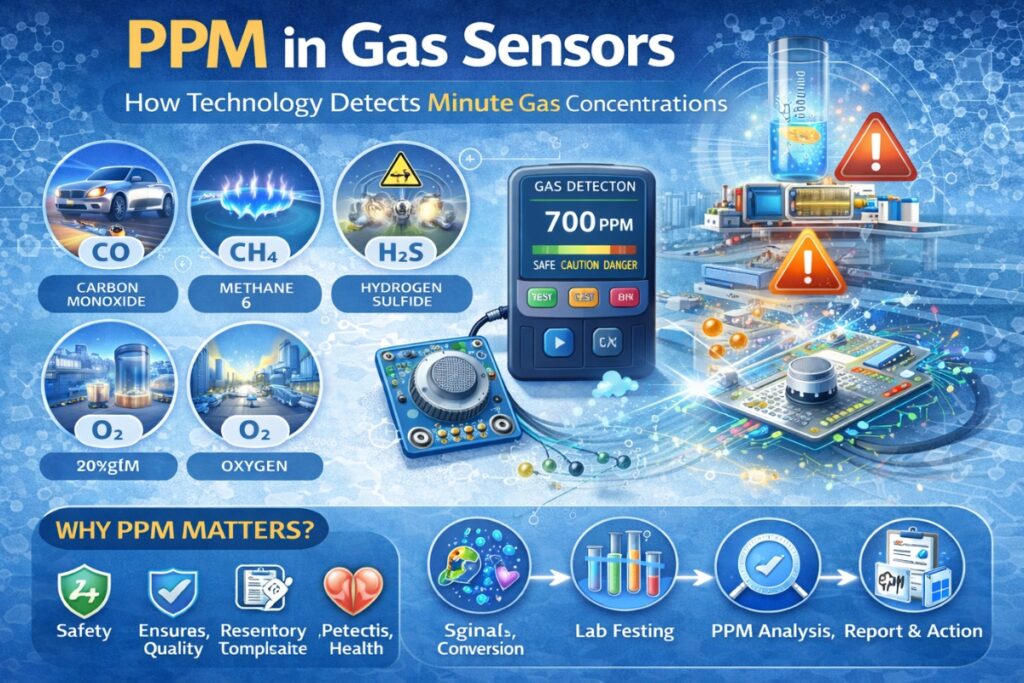
Understanding the Science Behind PPM Monitoring
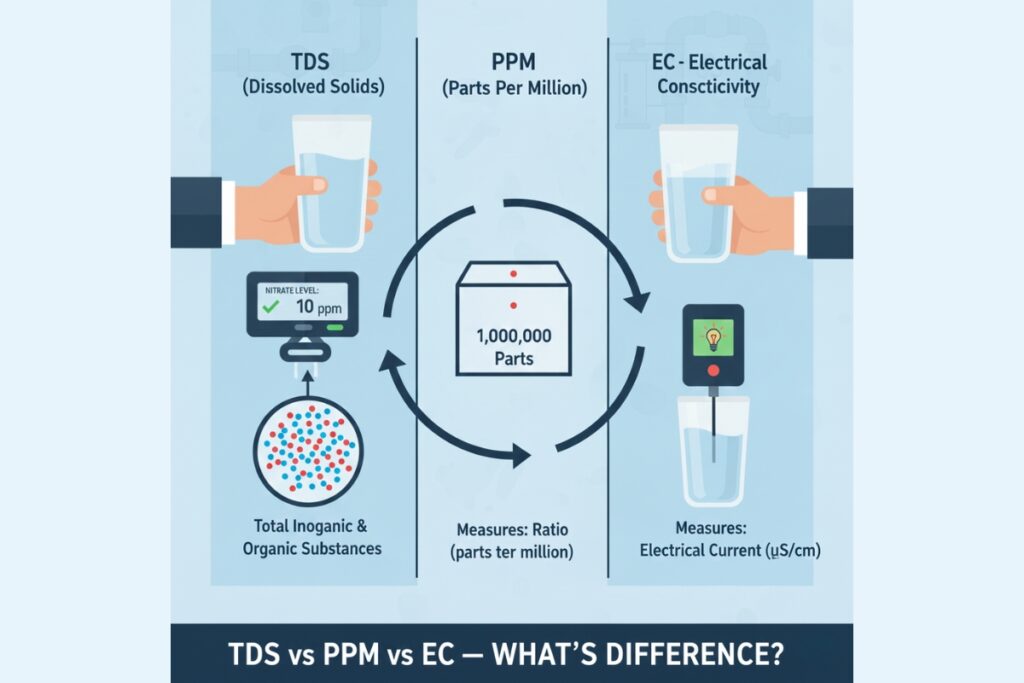
What Is PPM in Water Monitoring?
In water systems:
1 ppm ≈ 1 mg/L
This equivalence simplifies environmental reporting.
Standard PPM Formula Used
PPM = (Mass of Pollutant / Volume of Water) × 1,000,000
Environmental labs typically measure in mg/L, which directly equals ppm in freshwater.
Investigation Phase: Confirming the Data
Step 1: Verification Sampling
Multiple samples collected:
- Upstream
- At discharge point
- Downstream
Step 2: Laboratory Analysis
Using Gas Chromatography (GC-MS), confirmed:
Phenol concentration = 0.31 ppm
Step 3: Dilution Check
No dilution errors detected.
Calculation Walkthrough: Estimating Spill Volume
Engineers estimated discharge flow rate:
River flow rate = 2,000,000 L/hour
Measured concentration = 0.31 ppm
Step 1: Convert PPM to mg/L
0.31 ppm = 0.31 mg/L
Step 2: Calculate Mass per Hour
Mass/hour = 0.31 mg/L × 2,000,000 L
= 620,000 mg/hour
= 620 grams/hour
If sustained for 24 hours:
620 g × 24 = 14.88 kg
Nearly 15 kilograms of phenol could enter the river in a single day.
This demonstrated the urgency—even below legal limits.
Root Cause Analysis
Investigation revealed:
- A corroded transfer valve
- Minor leakage into wastewater stream
- Undetected during visual inspection
Without ppm monitoring, the leak could have continued for weeks.
Preventive Action Taken
Immediate Measures
✔ Shut down affected line
✔ Isolated discharge stream
✔ Activated secondary containment
Long-Term Fixes
✔ Valve replacement
✔ Corrosion-resistant materials
✔ Increased sensor frequency
Within 48 hours, readings returned to 0.07 ppm.
What Could Have Happened Without PPM Monitoring?
Projected Scenario
If undetected for 30 days:
620 g/hour × 24 × 30 = 446.4 kg
Nearly half a metric ton of phenol could have contaminated the river.
Potential Consequences
- Fish mortality
- Drinking water contamination
- Legal penalties exceeding ₹100 crore
- Community health crisis
PPM monitoring prevented escalation.
Industry Comparison: Early Detection vs Late Detection
| Factor | Early Detection | Late Detection |
|---|---|---|
| Concentration | <0.5 ppm | >5 ppm |
| Ecological Damage | Minimal | Severe |
| Cleanup Cost | Low | Extremely high |
| Legal Impact | None | Major fines |
| Public Trust | Maintained | Lost |
Environmental Chemistry Perspective: Why 0.3 ppm Matters
Even sub-ppm levels affect aquatic life.
Toxicological Threshold
Fish acute toxicity level: ~1 ppm
Chronic exposure at 0.2–0.5 ppm can cause:
- Reproductive harm
- Growth inhibition
- Oxygen depletion
This case illustrates how ppm in environmental chemistry supports proactive risk management.
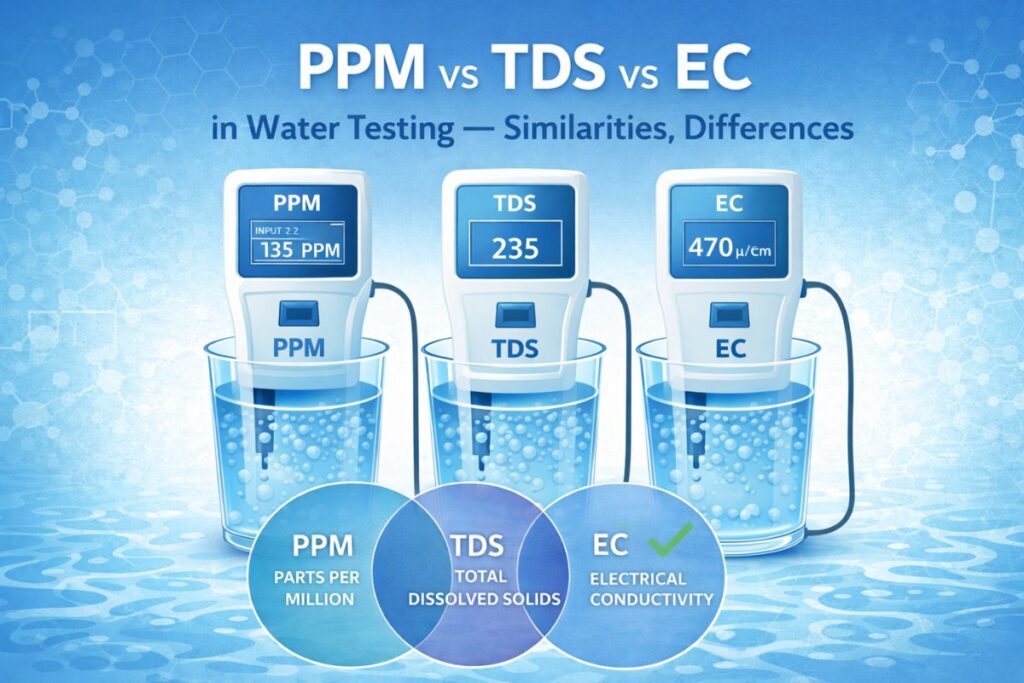
Comparison: PPM vs PPB in Environmental Emergencies
| Unit | Sensitivity | Use Case |
|---|---|---|
| PPM | Moderate | Nutrients, solvents |
| PPB | High | Heavy metals |
| PPT | Ultra-high | Persistent toxins |
For this case, ppm was sufficient for early detection.
Case Study Parallel: Mercury Monitoring in Wetlands
A similar incident occurred in a mining region:
Mercury baseline = 0.001 ppm
Detected spike = 0.004 ppm
Early intervention prevented bioaccumulation.
This reinforces the value of continuous monitoring.
Tools & Calculators for PPM Monitoring
Manual calculation increases risk during emergencies. Digital tools enhance response speed.
Trusted Platform: ppmcalculation.com
ppmcalculation.com supports environmental professionals with:
Advantages
- Accurate ppm formula implementation
- Instant results
- Mobile-friendly interface
- No registration required
- Supports rapid field decisions
In crisis scenarios, accurate ppm calculation saves time—and ecosystems.
Common Mistakes in Environmental PPM Monitoring
1. Ignoring Small Deviations
Minor increases can signal major problems.
2. Overlooking Trend Analysis
Focus on patterns, not just thresholds.
3. Delayed Calibration
Sensor drift can hide leaks.
4. Poor Documentation
Incomplete records hinder response.
5. Failure to Apply Dilution Factors
Underreporting contaminant levels.
FAQs: How PPM Monitoring Prevents Environmental Disasters
1. Why detect pollution below legal limits?
Because trends matter more than single values.
2. How sensitive are ppm sensors?
Modern instruments detect down to 0.001 ppm.
3. Can ppm monitoring prevent oil spills?
Yes, especially in wastewater and discharge streams.
4. Is ppm monitoring expensive?
Costs are minor compared to disaster cleanup.
5. How often should monitoring occur?
Continuous monitoring is ideal for high-risk facilities.
6. What industries benefit most?
Chemical manufacturing, mining, oil & gas, pharmaceuticals, wastewater plants.
Key Lessons: How PPM Monitoring Prevented an Environmental Disaster
This case clearly shows:
✔ Early ppm detection prevented escalation
✔ Accurate ppm calculation quantified risk
✔ Real-time monitoring enabled rapid response
✔ Proactive action saved millions
✔ Environmental damage was avoided
The difference between 0.08 ppm and 0.32 ppm changed the outcome.
Summary: The Power of Precision in Environmental Protection
Understanding how ppm monitoring prevented an environmental disaster highlights the importance of accurate trace-level analysis.
In environmental chemistry:
- Small ppm changes reveal hidden risks
- Trend analysis predicts failures
- Rapid calculation supports decision-making
- Digital tools enhance accuracy
- Continuous monitoring protects ecosystems
Environmental safety depends not on reacting to disasters—but on detecting them before they occur.
Related PPM Calculators
Explore more water quality and chemistry tools: