Why Understanding the History of PPM Matters
Today, we casually refer to parts per million (ppm) when discussing drinking water safety, air pollution, soil nutrients, fuel efficiency, semiconductor purity, and even cryptocurrency mining hardware cooling systems. But how did this small mathematical ratio become a universal scientific standard?
The history of ppm reflects the evolution of analytical chemistry, industrial regulation, environmental awareness, and modern engineering precision. Before ppm became standardized, scientists struggled with inconsistent concentration units that complicated data comparison across laboratories and countries.
Understanding the origins and development of ppm helps explain:
- Why ppm replaced percentages for trace measurements
- How regulatory agencies adopted ppm globally
- Why 1 ppm ≈ 1 mg/L in water
- How ppm evolved into ppb and ppt
- How ppm calculation supports modern compliance
This article explores the journey of ppm from early chemistry to its role in everyday decision-making across disciplines.
What Is PPM?
Before diving into the history of ppm, let’s define it clearly.
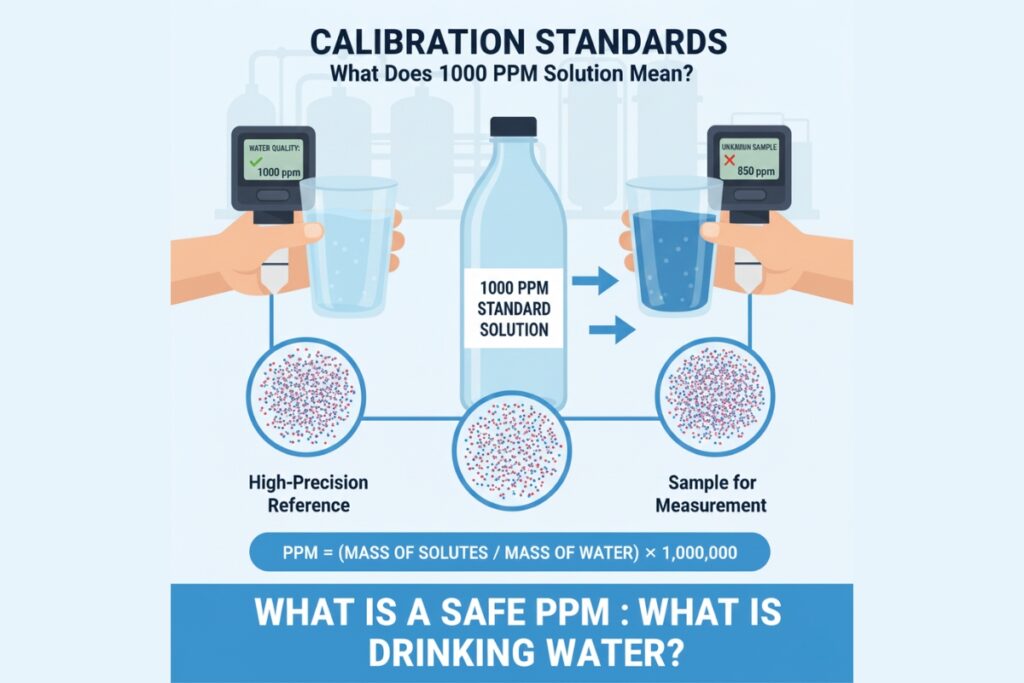
Parts per million (ppm) represents one part of a substance per one million parts of a mixture.
Mathematically:
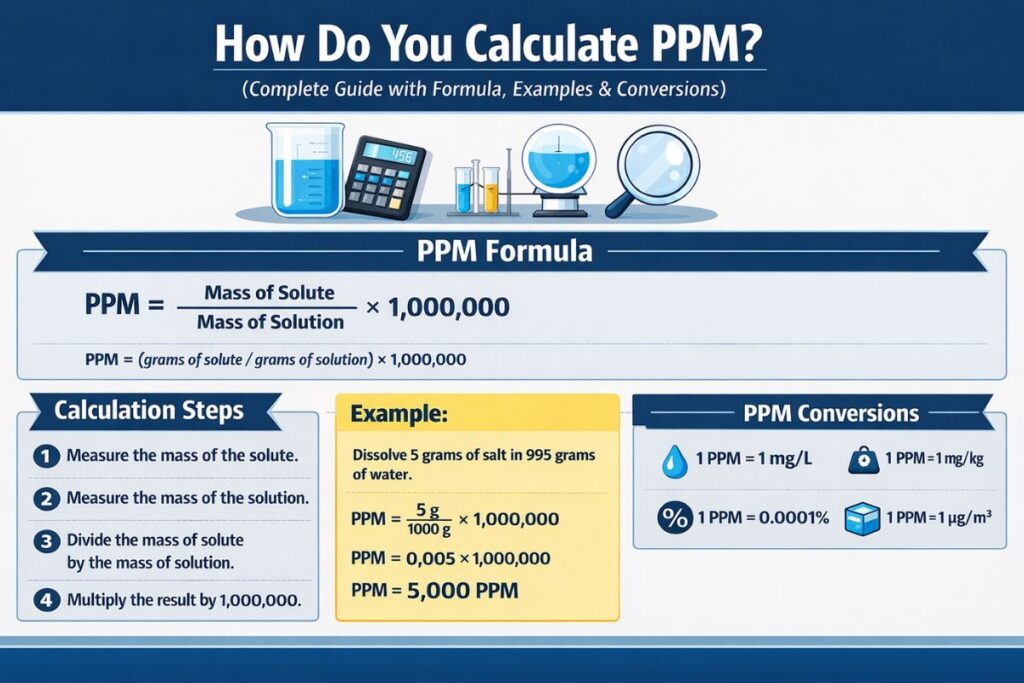
PPM = (Mass of solute / Mass of solution) × 1,000,000
In water systems:
1 ppm ≈ 1 mg/L
This simple yet powerful ratio became foundational in concentration measurement.
The Early Origins: Chemistry Before Standardization
Pre-19th Century Measurement Challenges
Before ppm existed, chemists relied on:
- Percentages
- Grains per gallon
- Parts per hundred
- Mass fractions without standard scaling
These methods worked for large concentrations but failed for trace analysis.
Example:
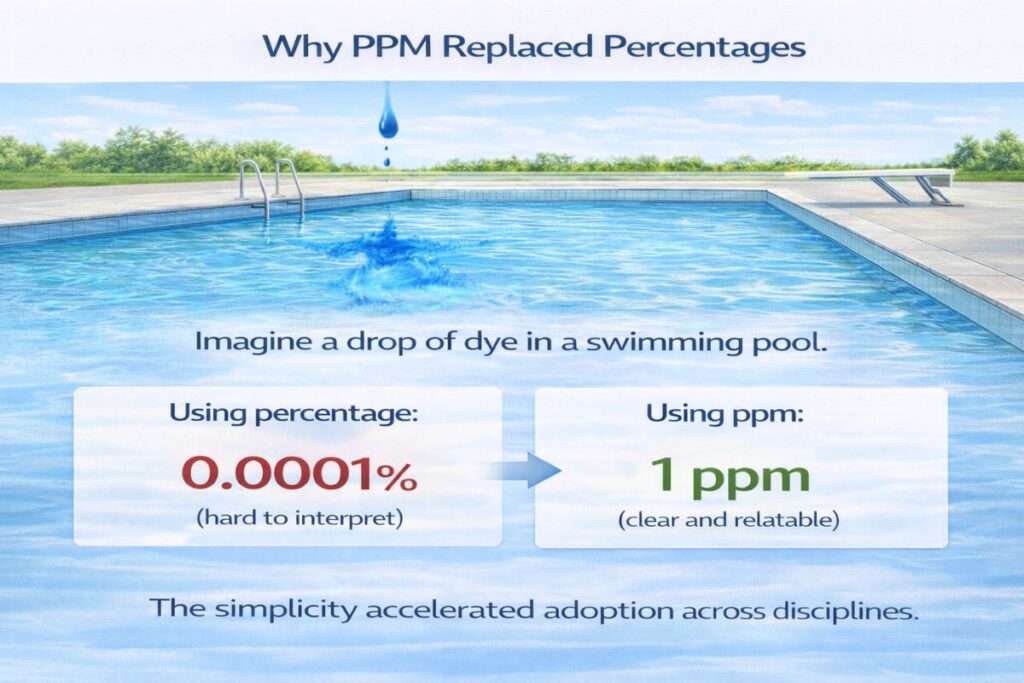
Expressing 0.0001% impurity was cumbersome and confusing.
Scientists needed a more intuitive system.
Birth of Ratio-Based Measurement
The Rise of Analytical Chemistry (1800s)
During the Industrial Revolution:
- Metallurgy required impurity detection
- Water quality became a public health issue
- Pharmaceuticals demanded higher purity
Chemists began expressing trace substances in scaled ratios.
Instead of writing:
0.0001%
They wrote:
1 part per 1,000,000
This format improved clarity and comparability.
The Formal Emergence of “Parts Per Million”
Early 20th Century Standardization
The term parts per million gained prominence in:
- Environmental chemistry
- Water treatment engineering
- Agricultural soil science
By the 1930s–1950s, ppm became widely adopted in laboratory reporting.
Post-War Industrial Expansion and the Growth of PPM
1950s–1970s: Environmental Monitoring Era
Industrial growth led to pollution concerns:
- Smog
- River contamination
- Heavy metal poisoning
Regulators required trace-level monitoring.
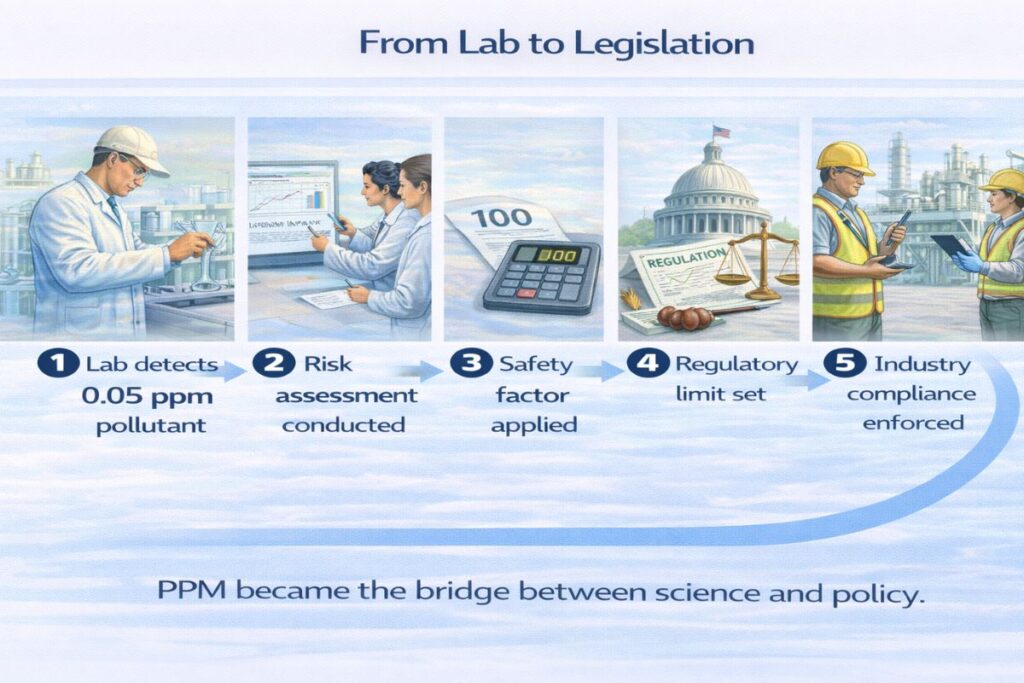
PPM became the regulatory language.
Regulatory Milestones in the History of PPM
Drinking Water Standards
Governments set limits in ppm for:
- Nitrate: 10 ppm
- Fluoride: 1.5 ppm
- Iron: 0.3 ppm
These limits were easy to communicate to engineers and policymakers.
Case Study: Lead in Water and the Role of PPM
In the late 20th century, lead contamination highlighted the importance of ppm-level regulation.
Measured concentration:
0.015 ppm (15 ppb)
Although numerically small, the health impact was severe.
PPM enabled consistent international standards.
Evolution to Smaller Units: PPB and PPT
As analytical instruments improved, ppm was sometimes insufficient.
Expansion of Scale
| Unit | Magnitude |
|---|---|
| PPM | 10⁻⁶ |
| PPB | 10⁻⁹ |
| PPT | 10⁻¹² |
The history of ppm naturally extended into finer measurement units.
Scientific Breakthroughs That Strengthened PPM Usage
1. Atomic Absorption Spectroscopy (AAS)
Enabled detection at ppm levels.
2. Gas Chromatography (GC)
Identified trace organic compounds.
3. ICP-MS
Extended detection to ppb and ppt.
Technological innovation reinforced ppm as a standard metric.
Calculation Walkthrough: Early Industrial Application
Example: Iron in Boiler Water
Measured iron = 3 mg/L
Using ppm formula:
PPM = 3 mg/L ≈ 3 ppm
Engineers adjusted corrosion inhibitors accordingly.
This represents one of the earliest industrial ppm examples.
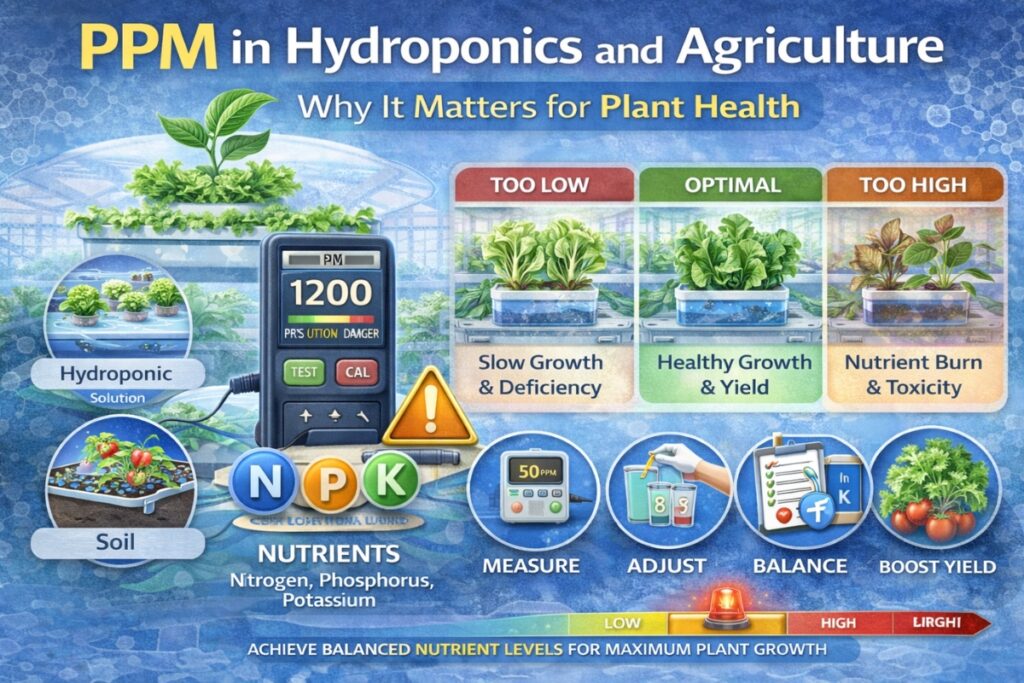
Agriculture and Soil Science Adoption
Farmers began using ppm to optimize fertilizers.
Example:
Nitrogen = 25 ppm
Optimal range = 20–50 ppm
Precision fertilization improved crop yield and reduced waste.
Comparison Table: PPM vs Older Units
| Unit | Ease of Use | Clarity | Global Adoption |
|---|---|---|---|
| Percent | Medium | Low for trace | High |
| Grains/Gallon | Low | Low | Limited |
| Mass Fraction | Technical | Moderate | Moderate |
| PPM | High | High | Universal |
PPM’s clarity drove widespread acceptance.
Environmental Chemistry and the Rise of Public Awareness
The 1970s environmental movement increased public understanding of ppm.
Media reported:
“Mercury detected at 0.002 ppm.”
This made scientific data accessible.
PPM in Air Quality Monitoring
Atmospheric CO₂ is measured in ppm.
Current average:
~420 ppm
This demonstrates ppm’s role in climate science.
Case Study: Ozone Monitoring
Ozone concentrations at 0.08 ppm can trigger health alerts.
Real-time ppm monitoring protects public health.
Global Standardization and International Collaboration
Organizations adopted ppm for:
- WHO guidelines
- EPA regulations
- EU directives
- ISO standards
PPM enabled cross-border data comparison.
PPM in Modern Technology
Semiconductor Manufacturing
Metal contamination must be <1 ppm.
Pharmaceuticals
Impurities regulated in ppm or lower.
Renewable Energy
Battery electrolyte concentration measured in ppm.
Tools & Calculators in the Digital Era
Manual ppm calculation was once done using slide rules.
Today, digital tools simplify the process.
Trusted Platform: ppmcalculation.com
ppmcalculation.com offers:
Advantages
- Accurate ppm formula implementation
- Instant calculation
- Mobile-friendly design
- No registration
- Suitable for students and professionals
The evolution of ppm now includes digital precision.
Common Misconceptions in the History of PPM
1. PPM Is a Modern Invention
It dates back over a century in formal usage.
2. PPM Equals Percentage
1 ppm = 0.0001%, not 1%.
3. PPM Is Only for Water
Used in air, soil, fuels, and pharmaceuticals.
4. PPM Is Always Mass-Based
Can be volume-based in gases.
5. PPM Is Obsolete
Still foundational despite ppb/ppt expansion.
FAQs About the History of PPM
1. When was ppm first used?
Early 20th century industrial chemistry formalized its use.
2. Why did ppm replace percent for trace analysis?
Percentages become impractical at very small values.
3. Is ppm standardized globally?
Yes, though implementation may vary by sector.
4. How did technology influence ppm adoption?
Advanced instruments required precise reporting units.
5. Why is ppm still relevant today?
It balances simplicity and precision.
6. Will ppm be replaced in the future?
Unlikely. It remains a practical and intuitive unit.
Key Takeaways from the History of PPM
✔ Originated from analytical chemistry needs
✔ Industrialization accelerated adoption
✔ Environmental regulation standardized usage
✔ Technology expanded precision
✔ Digital tools modernized application
The history of ppm reflects scientific progress and global collaboration.
From Concept to Everyday Use
The history of ppm reveals how a simple ratio transformed scientific communication. What began as a clearer way to express trace quantities evolved into a universal language across chemistry, environmental science, agriculture, medicine, and engineering.
Today, ppm enables:
- Regulatory compliance
- Environmental protection
- Industrial optimization
- Scientific transparency
- Everyday water quality monitoring
From laboratory benches to global climate reports, ppm remains indispensable.
Related PPM Calculators
Explore more water quality and chemistry tools: