Access to clean and safe drinking water is a fundamental human right. Yet, water contamination remains a major global concern due to industrial waste, aging infrastructure, agricultural runoff, and natural geological sources.
To protect public health, regulatory agencies define strict PPM levels in drinking water for chemicals, metals, and biological contaminants. These limits are expressed in parts per million (ppm) or lower units to ensure even trace pollutants are controlled.
A minor deviation in ppm calculation can result in:
- Long-term health disorders
- Developmental problems in children
- Chronic toxicity
- Legal penalties for suppliers
Understanding global standards set by organizations such as the World Health Organization (WHO) and the U.S. Environmental Protection Agency (EPA) is essential for engineers, policymakers, water operators, and consumers.
This comprehensive guide explains international drinking water standards, calculation methods, compliance practices, and real-world implications.
What Are PPM Levels in Drinking Water?
Understanding Parts Per Million in Water Quality
Parts per million (ppm) represents one part of a substance per one million parts of water.
In drinking water analysis:
1 ppm ≈ 1 mg/L
Because 1 liter of water weighs approximately 1 kilogram, ppm and mg/L are interchangeable in most water testing scenarios.
Why PPM Is Used in Drinking Water Regulations
PPM is preferred because it:
✔ Accurately reflects trace contamination
✔ Works across chemical categories
✔ Supports laboratory instrumentation
✔ Enables global standardization
It forms the basis of modern concentration measurement systems.
Overview of Global Drinking Water Regulatory Bodies
1. World Health Organization (WHO)
The WHO publishes international guidelines for drinking water quality, followed by over 190 countries.
Primary focus:
- Health-based limits
- Long-term exposure risks
- Developing nation support
2. U.S. Environmental Protection Agency (EPA)
The EPA enforces the Safe Drinking Water Act in the United States.
Key responsibilities:
- Setting Maximum Contaminant Levels (MCLs)
- Monitoring utilities
- Legal enforcement
3. European Union (EU Drinking Water Directive)
Provides standards for EU member states.
4. Bureau of Indian Standards (BIS)
India’s IS 10500 standard governs drinking water.
5. Health Canada & Other Agencies
Countries adopt WHO-based frameworks with local modifications.
WHO and EPA Drinking Water Standards: Comparison Table
Major Contaminants and Safe Limits
| Contaminant | WHO Limit (ppm) | EPA Limit (ppm) | Health Impact |
|---|---|---|---|
| Arsenic | 0.01 | 0.01 | Cancer risk |
| Lead | 0.01 | 0.015 | Neurological damage |
| Mercury | 0.006 | 0.002 | Kidney damage |
| Nitrate | 50 | 10 | Blue baby syndrome |
| Fluoride | 1.5 | 4.0 | Dental fluorosis |
| Iron | 0.3 | 0.3 | Taste issues |
| Copper | 2.0 | 1.3 | GI disorders |
| Chlorine | 5.0 | 4.0 | Irritation |
These values define acceptable PPM levels in drinking water worldwide.
Understanding Differences Between WHO and EPA Limits
Why Limits Vary
Although both agencies prioritize safety, limits differ due to:
- Regional exposure patterns
- Climate conditions
- Water consumption habits
- Economic feasibility
- Treatment technologies
Example: Fluoride
WHO: 1.5 ppm
EPA: 4.0 ppm
The EPA allows higher fluoride due to controlled fluoridation programs and dental health policies.
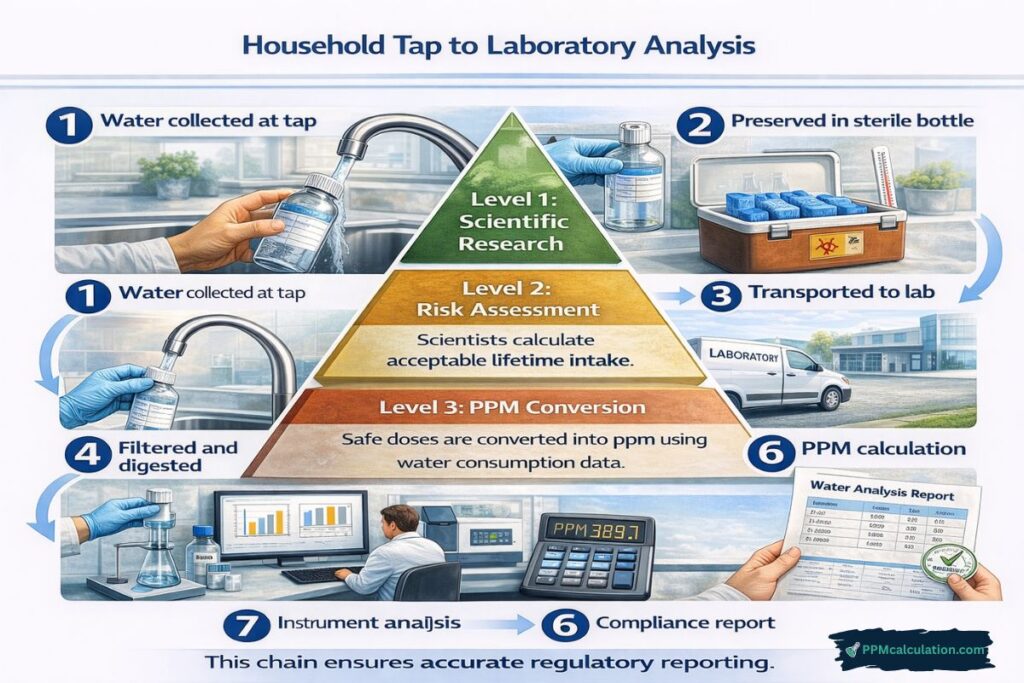
PPM Calculation for Regulatory Compliance
Standard PPM Formula
PPM = (Mass of Contaminant / Volume of Water) × 1,000,000
For water:
PPM ≈ mg/L
Practical Compliance Formula
PPM = Measured Concentration (mg/L)
Most laboratory instruments directly report mg/L.
Calculation Walkthrough: Lead Compliance Testing
Scenario
Lab report shows:
Lead concentration = 0.012 mg/L
Step 1: Convert to PPM
0.012 mg/L ≈ 0.012 ppm
Step 2: Compare with EPA Limit
EPA limit = 0.015 ppm
Result
0.012 < 0.015 → Compliant
Action
Continue monitoring.
This is a standard ppm example in utility audits.
PPM to mg/L Conversion in Water Standards
General Rule
1 ppm = 1 mg/L (for drinking water)
Exception
High-salinity water requires density correction.
Example:
Seawater density = 1.025 kg/L
1 ppm ≈ 0.975 mg/LIndustry Case Study 1: Lead Crisis in Municipal Water Supply
Background
A U.S. city changed its water source.
Result:
- Corrosion increased
- Lead leached from pipes
- Lead levels reached 0.03 ppm
Impact
- Public health emergency
- Thousands affected
- Federal intervention
Lesson
Strict monitoring of PPM levels in drinking water is critical.
Industry Case Study 2: Arsenic in Groundwater (South Asia)
Scenario
Rural communities relied on groundwater.
Test Results:
- Arsenic: 0.08 ppm
- WHO limit: 0.01 ppm
Consequences
- Skin lesions
- Cancer risks
- Mass displacement
Solution
- Reverse osmosis plants
- Centralized testing
- Digital ppm monitoring
Contaminant Categories and Their PPM Limits
1. Heavy Metals
| Metal | Limit (ppm) | Risk |
|---|---|---|
| Lead | 0.015 | Brain damage |
| Cadmium | 0.005 | Kidney failure |
| Chromium | 0.05 | Carcinogenic |
| Nickel | 0.02 | Allergic effects |
2. Inorganic Chemicals
| Chemical | Limit (ppm) |
|---|---|
| Nitrate | 10 |
| Nitrite | 1 |
| Sulfate | 250 |
| Chloride | 250 |
3. Disinfectants
| Disinfectant | Limit (ppm) |
|---|---|
| Chlorine | 4 |
| Chloramine | 4 |
| Ozone | 0.1 |
Monitoring and Compliance in Water Utilities
Testing Frequency
| Parameter | Frequency |
|---|---|
| Chlorine | Daily |
| Lead | Quarterly |
| Arsenic | Annually |
| Nitrates | Monthly |
Documentation
Utilities must maintain:
- Historical ppm data
- Calibration records
- Audit reports
Failure leads to penalties.
Tools & Calculators for PPM Compliance
Manual analysis is error-prone. Digital platforms simplify compliance.
Trusted Platform: ppmcalculation.com
ppmcalculation.com provides industry-grade tools for water professionals and consumers:
Benefits
- Accurate ppm formula implementation
- Instant conversion
- Mobile-friendly
- No registration
- Audit-ready outputs
These tools support regulatory reporting and internal audits.
Common Mistakes in Interpreting Drinking Water PPM Standards
1. Confusing ppm with ppb
Many limits (e.g., arsenic) are in ppb, not ppm.
2. Ignoring Averaging Rules
Some limits are annual averages, not single readings.
3. Improper Sampling
Poor containers contaminate samples.
4. Outdated Standards
Using obsolete guidelines risks non-compliance.
5. Overlooking Seasonal Variations
Rainfall and temperature affect ppm levels.
Frequently Asked Questions (FAQs)
1. Is ppm safe for all contaminants?
No. Some chemicals are harmful even below 1 ppm.
2. Why are some limits in ppb instead of ppm?
Highly toxic substances require stricter control.
3. Can home test kits measure ppm accurately?
They provide estimates. Lab testing is more reliable.
4. How often should consumers test water?
At least once per year, more if using well water.
5. What happens if ppm exceeds limits?
Utilities must issue advisories and take corrective action.
6. Are WHO limits legally binding?
They are guidelines. National agencies enforce laws.
Why Global Standards for PPM Levels Matter
Global regulations for PPM levels in drinking water protect billions of people from invisible health risks.
Key Takeaways
✔ WHO and EPA set science-based limits
✔ PPM ensures trace-level safety
✔ Accurate ppm calculation supports compliance
✔ Regular monitoring prevents crises
✔ Digital tools enhance reliability
Understanding and applying these standards is essential for sustainable water management.
Related PPM Calculators
Explore more water quality and chemistry tools: